일반적으로 로그 파일에는 info 와 error 가 혼합되어 있고 규모가 클수록 error 발생 빈도를 한 눈에 파악하긴 어렵다.
이럴 때 cat, grep, wc를 함께 사용하면 ERROR가 찍힌 숫자를 확인할 수 있다.
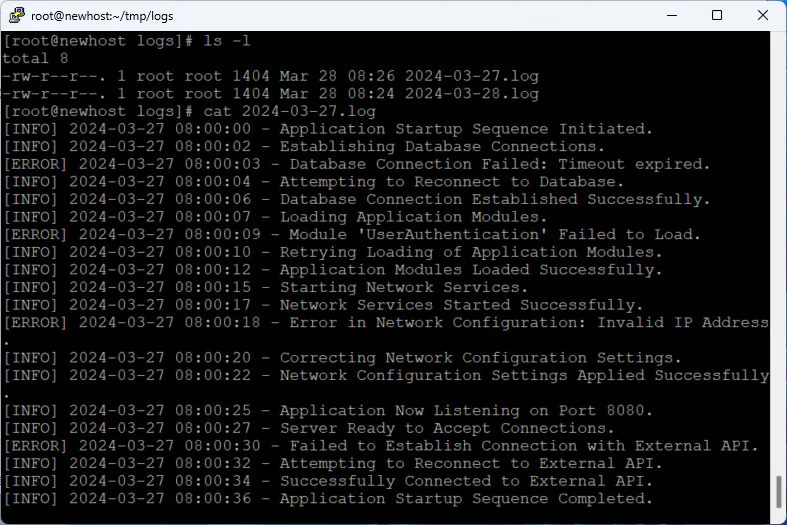
1. 로그 파일 확인
예시 로그 파일을 보면 각 라인이 [INFO] 와 [ERROR] 형태로 저장되어 있다.
ERROR 라는 단어를 grep으로 필터링 할 수 있다.
[root@newhost logs]# cat 2024-03-27.log | grep ERROR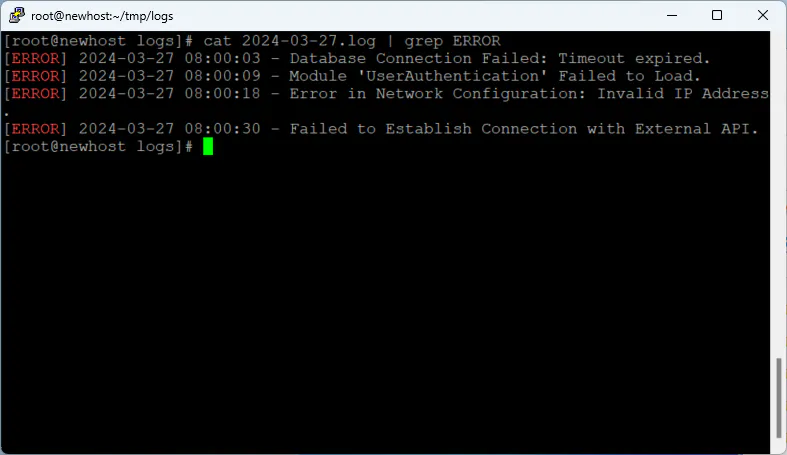
2. ERROR 라인 수 확인
필터링한 라인 수를 wc로 카운트하면 ERROR 발생 개수가 나온다.
[root@newhost logs]# cat 2024-03-27.log | grep ERROR | wc -l
4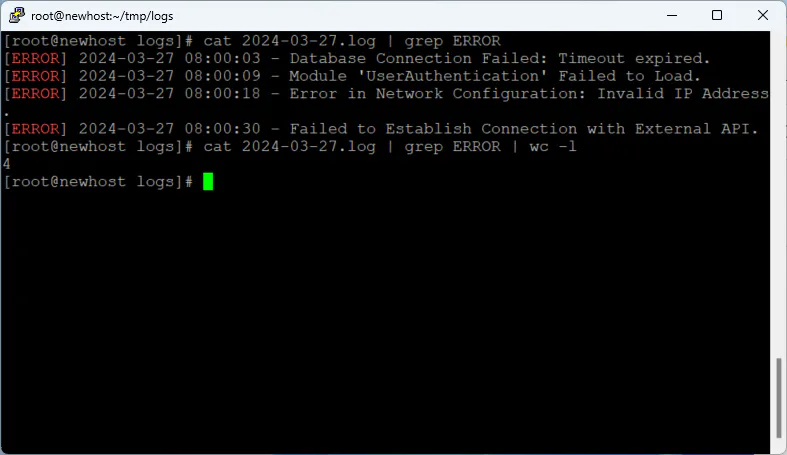
3. 여러 파일 동시에 확인
패턴을 사용하면 여러 파일을 종합하여 확인 가능하다. 예를 들어 2024년 3월 발생한 전체 로그에서 ERROR가 발생한 건수를 확인하려면
[root@newhost logs]# cat 2024-03*.log | grep ERROR | wc -l
8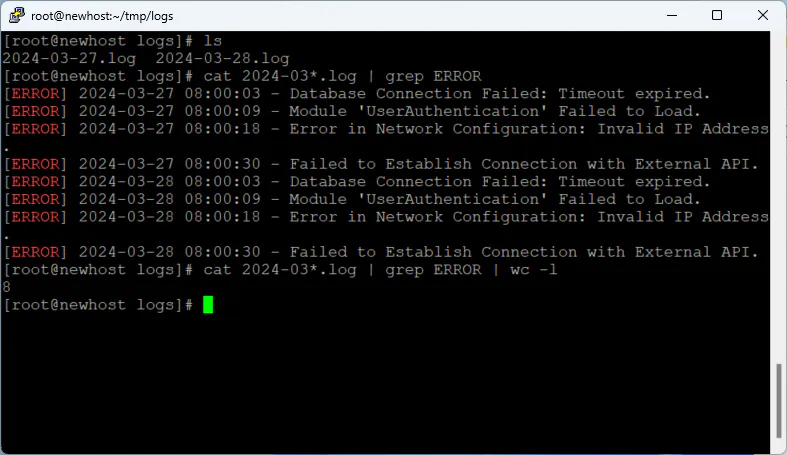
이런 방식으로 쓸 수 있다.